Argo Lite: Open-Source Interactive Graph Exploration and Visualization in Browsers

 Zhiyan Zhou
Anish Upadhayay
Zhiyan Zhou
Anish Upadhayay
 Scott Freitas

 Susanta Routray
Matthew Hull
Susanta Routray
Matthew Hull

Abstract
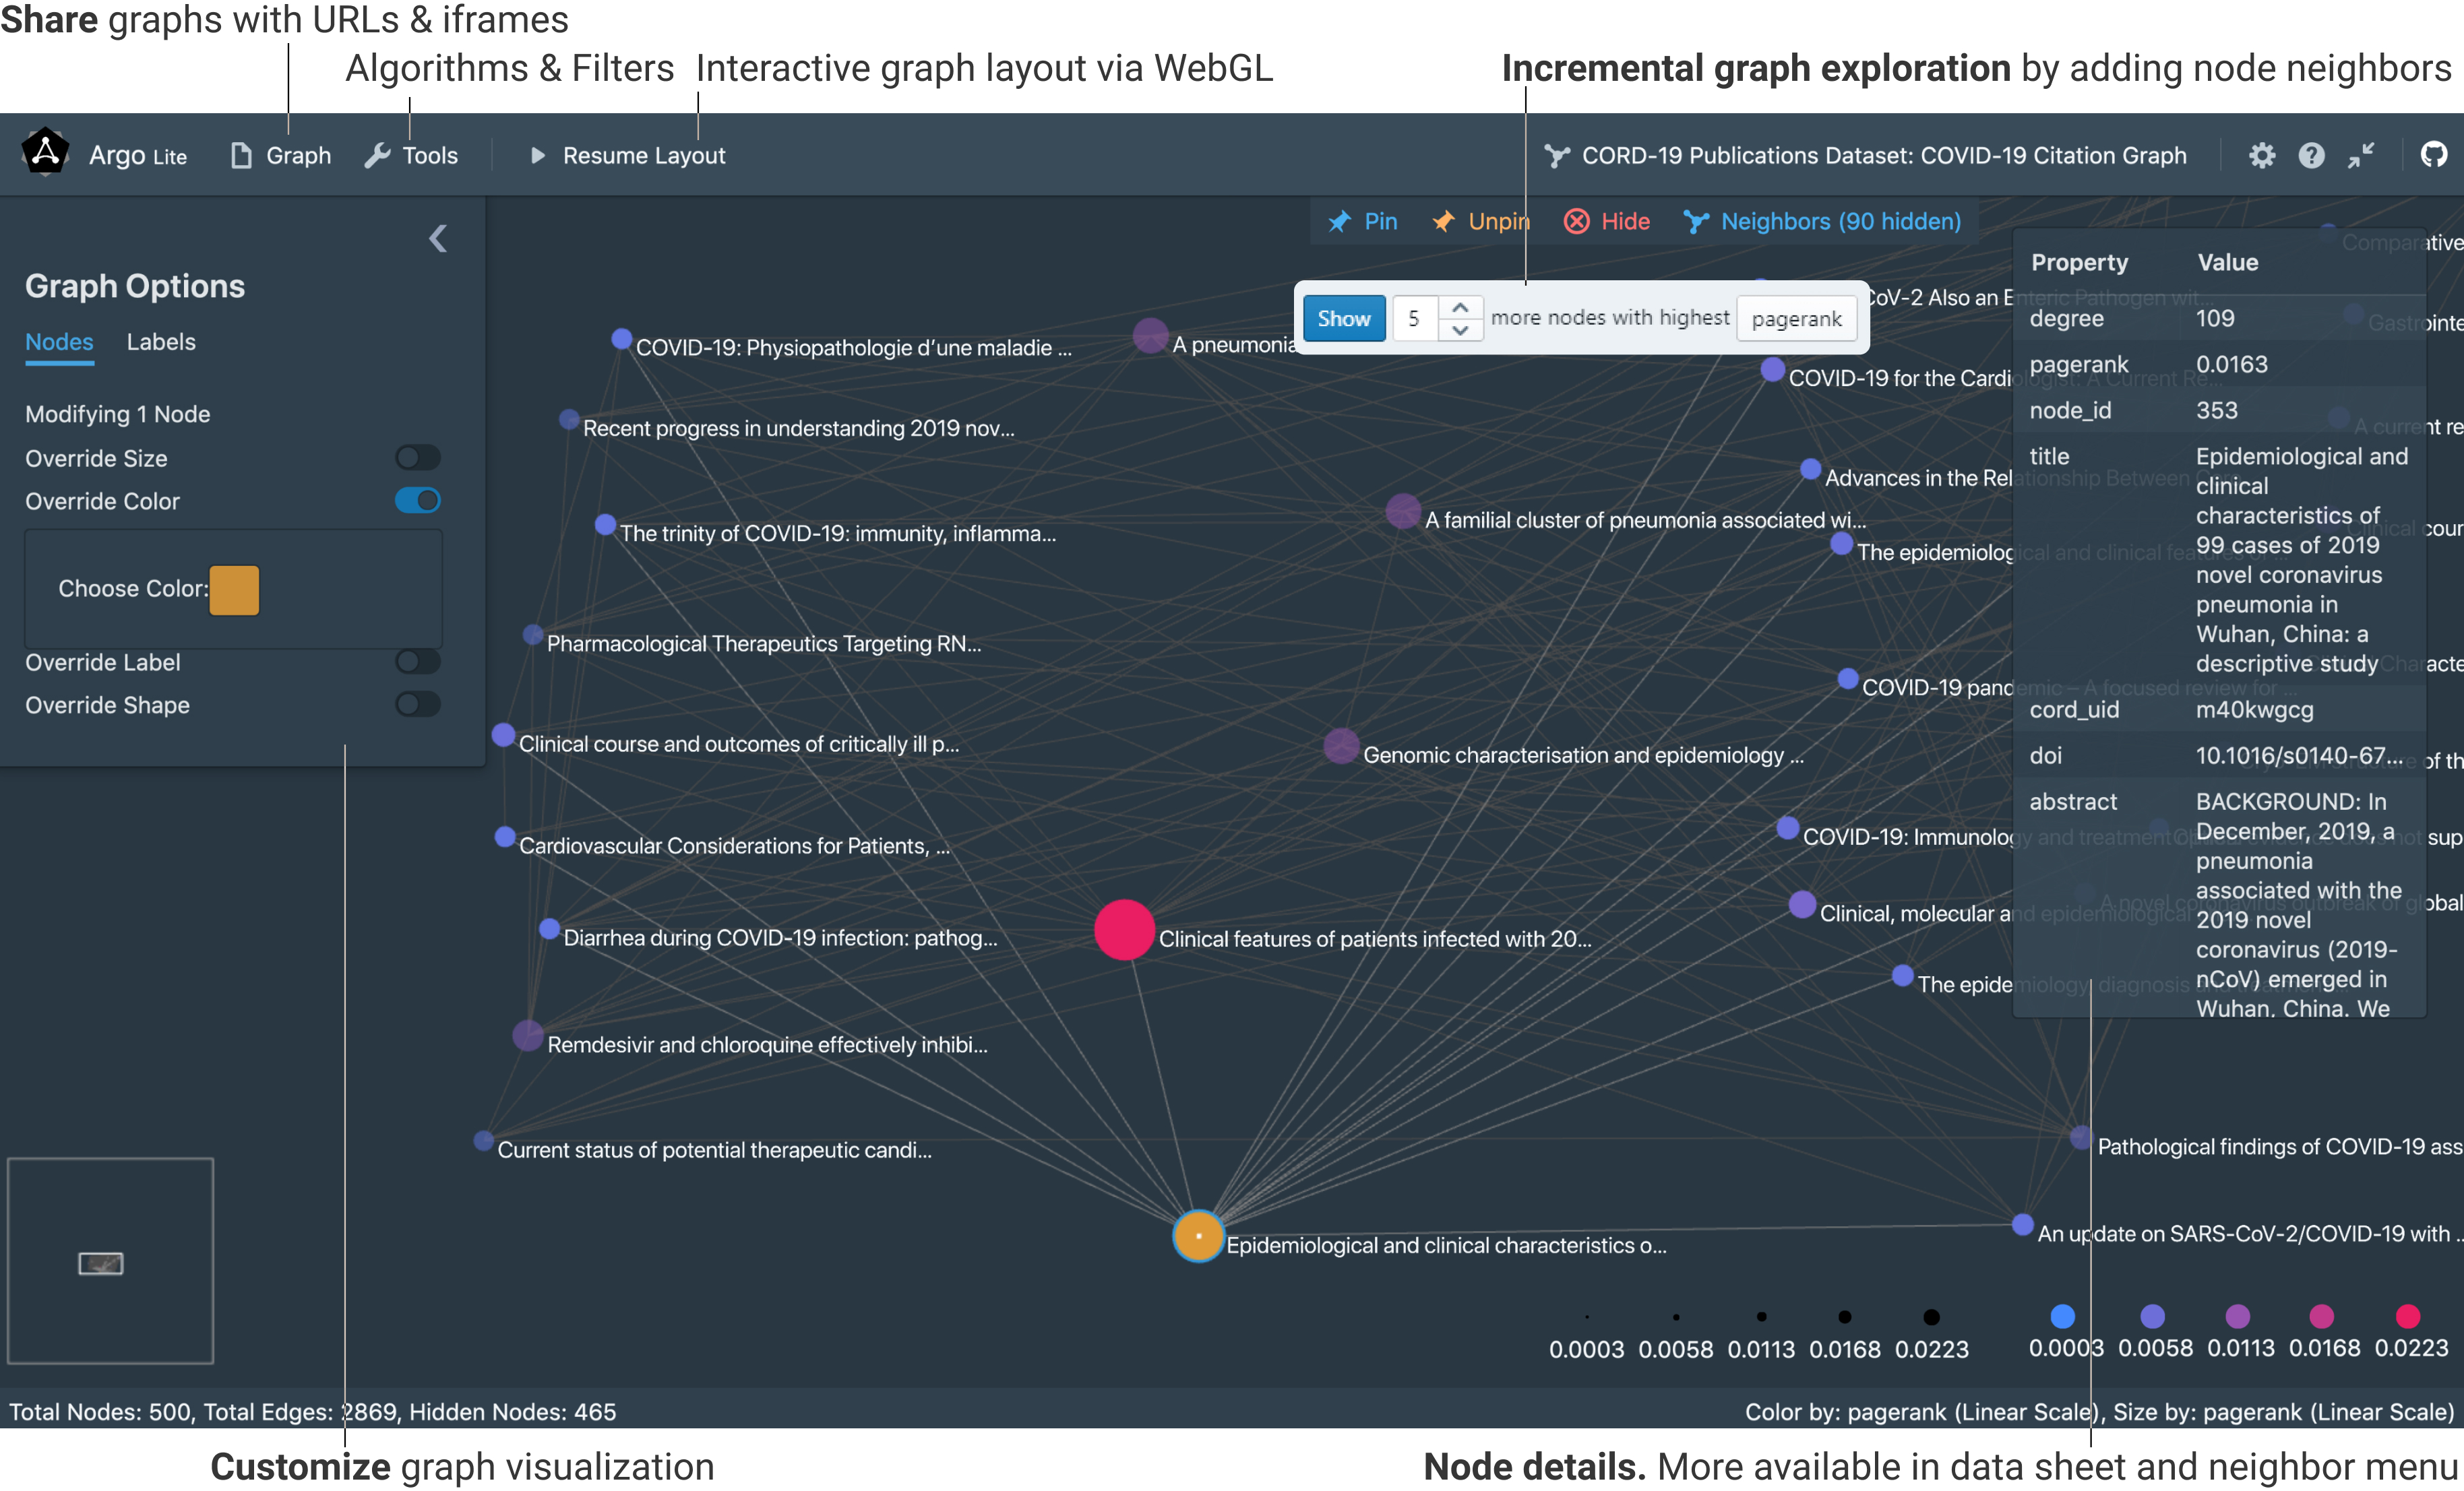
Graph data have become increasingly common. Visualizing them helps people better understand relations among entities. Unfortunately, existing graph visualization tools are primarily designed for single-person desktop use, offering limited support for interactive web-based exploration and online collaborative analysis. To address these issues, we have developed Argo Lite, a new in-browser interactive graph exploration and visualization tool. Argo Lite enables users to publish and share interactive graph visualizations as URLs and embedded web widgets. Users can explore graphs incrementally by adding more related nodes, such as highly cited papers cited by or citing a paper of interest in a citation network. Argo Lite works across devices and platforms, leveraging WebGL for high-performance rendering. Argo Lite has been used by over 1,000 students at Georgia Tech’s Data and Visual Analytics class. Argo Lite may serve as a valuable open-source tool for advancing multiple CIKM research areas, from data presentation, to interfaces for information systems and more.
Materials
BibTeX
@inproceedings{10.1145/3340531.3412877,
  author = {Li, Siwei and Zhou, Zhiyan and Upadhayay, Anish and Shaikh, Omar and Freitas, Scott and Park, Haekyu and Wang, Zijie J. and Routray, Susanta and Hull, Matthew and Chau, Duen Horng},
  title = {Argo Lite: Open-Source Interactive Graph Exploration and Visualization in Browsers},
  year = {2020},
  isbn = {9781450368599},
  publisher = {Association for Computing Machinery},
  address = {New York, NY, USA},
  url = {https://doi.org/10.1145/3340531.3412877},
  doi = {10.1145/3340531.3412877},
  booktitle = {Proceedings of the 29th ACM International Conference on Information & Knowledge Management},
  pages = {3071–3076},
  numpages = {6},
  keywords = {network analysis, interactive graph visualization, user interface design},
  location = {Virtual Event, Ireland},
  series = {CIKM '20}
}